

Planning is where every successful project begins — and the Gantt chart remains one of the most powerful ways to bring order to complexity. It helps teams see the big picture and keep projects on track. But what happens after the plan is made? That’s where many projects lose momentum — not because the chart failed, but because individual task management did. This post looks at both sides: how visualization tools like Gantt charts drive coordination, and why personal task discipline keeps the whole system moving.
If you’ve ever managed a significant-sized project — say, a construction site, a research study, or a multi-department rollout — you’ve probably encountered a Gantt chart. And once you’ve used one properly, you rarely forget its utility.
A Gantt chart is more than a timeline — it’s a visual language for managing complexity.It allows you to see how a project truly moves — and where it might stall. At a glance, you can understand:
- How tasks are sequenced and where dependencies exist
- Which milestones mark progress along the way
- How resources are distributed — and where they might overload
- How delays in one part affect the whole project
- This visualization transforms complexity into clarity.
It converts what would otherwise be a spreadsheet of chaos into a map of logic — one where every moving part is visible. When you’re orchestrating multiple people, timelines, and constraints, that visual structure isn’t a luxury — it’s survival.
It helps project managers allocate resources effectively, adjust priorities intelligently, and keep everyone aligned to reality rather than assumptions.
Many workplaces use enterprise tools like MS Project, Asana, or Jira to manage these dynamics. But when it comes to personal or small-scale projects, I’m often asked to recommend a tool that’s free or inexpensive, yet practical enough to plan and visualize real work. For such cases, a simpler alternative works wonders.
That’s where GanttProject shines. It’s free, open-source, and beautifully visual. You can define tasks, link dependencies, assign resources, and instantly see how milestones and workloads line up.
For engineers, researchers, or small teams, it provides just enough structure to manage real-world complexity — without the overhead of big project suites. It’s a perfect way to see your project before it starts moving.
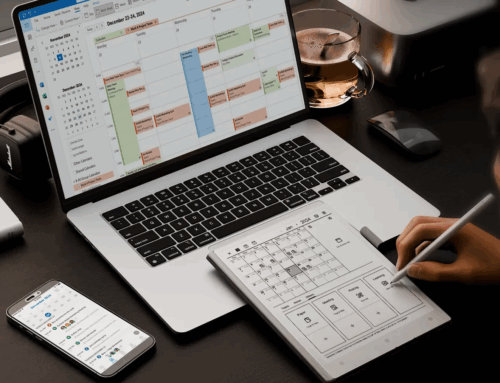
That same discipline doesn’t translate well into your personal workday. When it’s just you — at your desk, in meetings, or out on the field — you don’t need dependency mapping; you need clarity of the next action. That’s where the line between project management and personal task management becomes clear.
A Gantt chart gives you the plan view, but execution happens through task flow. And while most organizations train their teams on project tools, few help individuals build effective personal work systems. It’s often left to preference — sticky notes, reminders, scattered apps — until something slips.
And that’s where even well-planned projects lose momentum: not through poor charts, but through unstructured personal execution.
Interestingly, contrary to what many might assume, a personal task system doesn’t have to interfere with individual work preferences. There are several well-known methodologies for task management, each varying in rigor and sophistication — the simplest being the humble to-do list. It’s not rocket science though. Its purpose is simply to anchor people to their current priorities while making it easy to update those priorities and maintain the flexibility to choose tasks.
A Gantt chart ensures collective alignment; a disciplined task system ensures individual reliability. Both are essential layers of productivity — one maps the journey, the other fuels the motion.
Subscribe to my newsletter, to get tips like this and more, directly in your inbox!
(Originally published in Times of India on November 9, 2025)